简介
编写好了golang服务之后,接着要开始关注服务的CPU,内存使用情况。golang提供了性能剖析工具,记录一些自己搜集到的信息,写下一些实践的情况。在golang中内置了pprof工具,专门来做golang语言的优化。
1.安装环境
1 | go get -u github.com/google/pprof |
在Ubuntu系统中安装Graphviz,可以按照以下步骤进行:
- 打开终端:首先,打开Ubuntu的终端。
- 安装Graphviz:
- 在终端中,输入以下命令并按Enter键来安装Graphviz:
1
2
sudo apt update # 更新软件包列表(可选,但推荐)
sudo apt install graphviz # 安装Graphviz - 系统会提示你输入密码以继续安装。输入密码后(密码在输入时不会显示),按Enter键。
- 安装过程中,如果系统询问你是否要继续,输入“Y”并按Enter键。
- 在终端中,输入以下命令并按Enter键来安装Graphviz:
- 验证安装:安装完成后,你可以通过输入以下命令来验证Graphviz是否已正确安装:
1
which dot
- 如果Graphviz已正确安装,该命令将显示
dot命令的路径。
- 如果Graphviz已正确安装,该命令将显示
注意:
- 如果你在尝试安装Graphviz时遇到依赖关系问题,你可以尝试使用
sudo apt -f install命令来修复它们。这会自动安装缺失的依赖包。 - 如果你的Ubuntu版本较旧,并且默认的Graphviz版本不符合你的需求,你可以考虑从Graphviz的官方网站下载最新的版本并按照特定的安装说明进行安装。但通常情况下,Ubuntu的软件包管理器提供的版本应该足够满足大多数用户的需求。
- 如果你计划使用Graphviz的Python接口(如PyGraphviz),请确保在安装Graphviz之前已经安装了Python环境,并且在安装PyGraphviz时可能需要安装额外的依赖项(如gcc)。
需要去下载一个绘图的库。
.gv文件就是dot工具能读取,并且画图的文件格式。
也推荐使用Graphviz Interactive-VSCode插件
2.性能监控代码
这段代码将会开启一个http的网站,对外提供监控访问的地址。
1 | import ( |
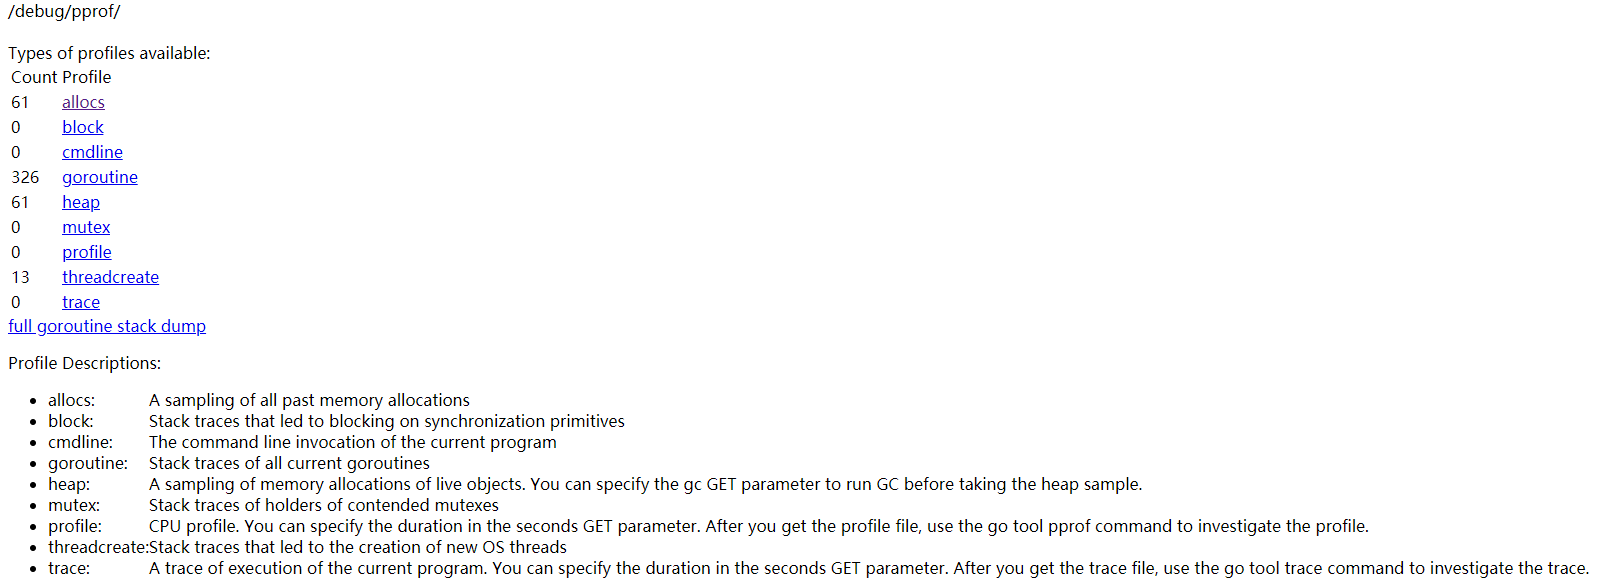
能通过这个网址检查程序的内存分配,CPU占用,mutex,gorouine之类的信息。可以直接通过浏览器访问获取信息。
- CPU profile:报告程序的 CPU 使用情况,按照一定频率去采集应用程序在 CPU 和寄存器上面的数据
- Memory Profile(Heap Profile):报告程序的内存使用情况
- Block Profiling:报告 goroutines 不在运行状态的情况,可以用来分析和查找死锁等性能瓶颈
- Goroutine Profiling:报告 goroutines 的使用情况,有哪些 goroutine,它们的调用关系是怎样的
3.CPU性能查看
打开一个命令行输入:
1 | PS D:\work\trunk\doc> go tool pprof -http="0.0.0.0:8081" http://127.0.0.1:10003/debug/pprof/profile?seconds=200 |
在本地将会开启 -http=”:8081” 表示在8081网站,将会呈现最后结果。这次监控将会抓取 http://127.0.0.1:10006/debug/pprof/profile 提供的性能信息。?seconds=200 表示持续抓取200sec。到时间之后它们将会存储到本地的一个文件中: Saved profile in C:\Users\xxxxxxxxx\pprof\pprof.samples.cpu.003.pb.gz 。
想知道这个处理的细节,可以直接阅读golang的源码:
1 | // C:\Go\src\net\http\pprof\pprof.go |
它的接口有两个能支持输入seconds
1 | "trace": "A trace of execution of the current program. You can specify the duration in the seconds GET parameter. After you get the trace file, use the go tool trace command to investigate the trace.", |
通过加载文件来调出分析网站:
1 | PS D:\work\trunk\doc> go tool pprof -http="192.168.125.224:8989" C:\Users\xxxxxxxxx\pprof\pprof.samples.cpu.003.pb.gz |
也能通过这个命令直接加载之前监控的剖析文件。
| 列名 | 含义 |
|---|---|
| flat | 函数时间(不包括子函数)。这里不包括函数等待子函数返回。 |
| flat% | flat / 总采样时间值 |
| sum% | 前面每一行的flat占比总和 |
| cum | 函数总时间(包括子函数)。因此 flat <= cum |
| cum% | cum占用总时间的比例 |
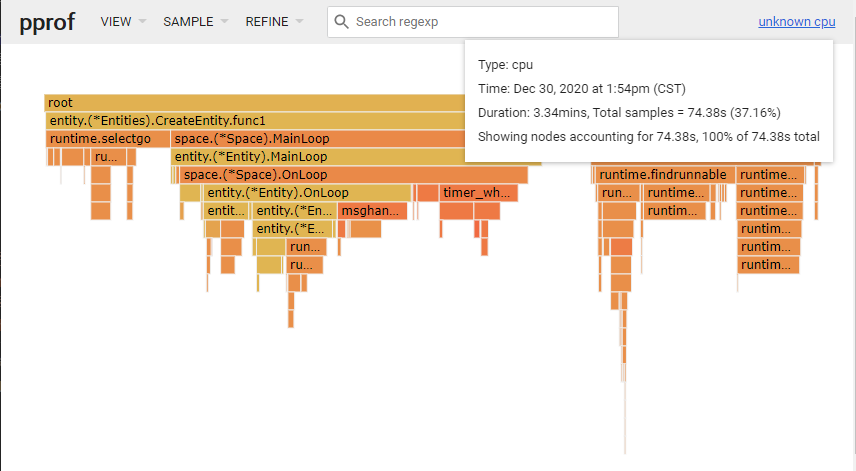
火焰图方式
调用关系图
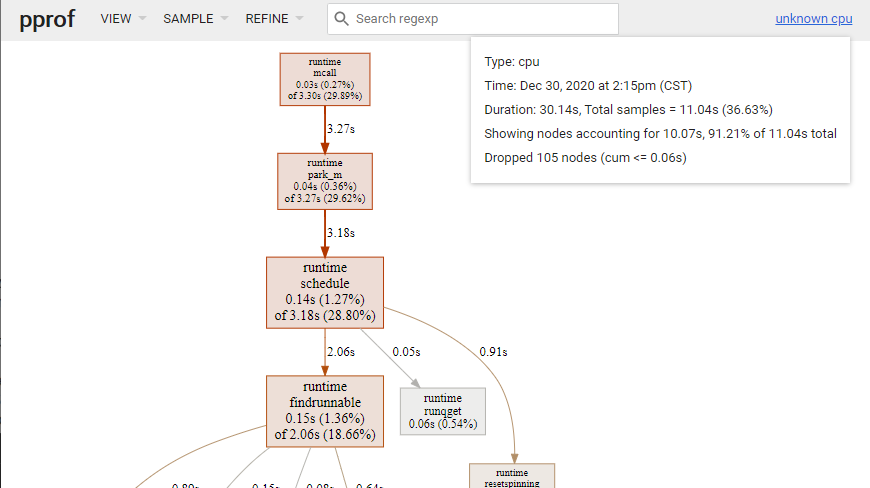
图片说明:
内存泄漏
1 | # 生成一次heap的占用 |
2021-11-03我们发现过一次内存泄露,是由于goroutine虽然被关闭了,但是没有将其及时释放掉(释放会每10分钟发起释放,每次释放100。修改之后的版本,将会10秒发起一次,每次将会释放5000个goroutine。),造成的内存激增。我们可以打开pprof/heap页面。观察网页最后结束的信息。
1 | # runtime.MemStats |
通过观察,可以发现HeapAlloc分配的内存,能从heap的剖析看的出来。但是HeapSys、HeapIdle内存过大的时候,无法从统计图里面看出来。内存申请的流程大概是这个过程:
HeapAlloc是当前在使用的内存,如果需要增加的时候,将会去HeapIdle中申请。如果HeapIdle里面内存都用光了,将会发起对系统的内存申请。- 虽然已经将goroutine停止了,但是goroutine相关的上下文内存将无法归还,可能挂在heap分析树上的goroutine的内存微乎其微,但是其关联的内存块将无法被系统回收掉。这一点,观察发现
HeapSys、HeapIdle数值将会一直增长。 - 所以如果出现这样的问题可以考虑将服务器中的协程分析一下,因为里面可能有闭包,环境资源被golang的虚拟机占用,无法回收。等下一轮的内存需要使用的时候,将会出现无法分配更多的内存。
在看heap的图表的时候,主要通过2个维度来分析:
alloc分配的内存大小,inuse当前还在使用的内存。objects统计个数,space统计占用的内存大小。
golang语言的内存回收。
3.引用
- [1] 火焰图工具网站
- [2] Golang性能测试工具PProf应用详解
- [3] 深度解密go语言之pprof
- [4] graphviz官网
- [5] Go 大杀器之性能剖析 PProf
- [6] qcachegrindwin下载地址
- [7] golang内存泄漏的排查记录